Machine Learning · Data Science
Why accuracy lied about my churn model
When I started my Customer Churn Intelligence project, my first instinct was to chase accuracy. Then I trained a model that does nothing at all, and it scored 73.5%.
The problem with a 73.5% model that does nothing
The IBM Telco Customer Churn dataset has 7,043 customers, and about 26.5% of them leave. That imbalance changes everything. A “dummy” classifier that predicts nobody churns is right for the 73.5% who stay, so it looks respectable on accuracy, while catching exactly zero of the customers the business actually cares about.
On imbalanced data, accuracy mostly measures how common the majority class is.
So before comparing models, I decided what “good” meant for the business. Missing a customer who is about to leave (a false negative) costs recurring revenue and an expensive re-acquisition. A false alarm (a false positive) costs a small retention offer. That asymmetry pointed to three metrics instead of accuracy: ROC-AUC, PR-AUC and churn recall.
A fair comparison first
I compared a dummy baseline, Logistic Regression, an SVC and a Random Forest with 5-fold stratified cross-validation. Two details mattered more than the algorithms themselves:
- No leakage. Scalers and one-hot encoders live inside a scikit-learn
ColumnTransformerpipeline, so they are fitted only on each training fold, never on data the model is evaluated on. - A baseline to beat. The dummy model’s PR-AUC of 0.265 is simply the churn rate. Any real model has to clear that bar to be worth anything.
| Model (5-fold CV) | ROC-AUC | PR-AUC | Recall |
|---|---|---|---|
| Random Forest | 0.847 | 0.659 | 0.793 |
| Logistic Regression | 0.846 | 0.660 | 0.801 |
| SVC (RBF) | 0.827 | 0.607 | 0.780 |
| Dummy baseline | 0.500 | 0.265 | 0.000 |
Random Forest and Logistic Regression were almost tied. I tuned the Random Forest with GridSearchCV, optimizing for ROC-AUC, and only then touched the untouched test set once.
What the test set said
On 1,409 held-out customers, the tuned model reached a ROC-AUC of 0.843 and a PR-AUC of 0.653, and caught 297 of 374 churners (79% recall). The trade-off is visible in the confusion matrix: 270 customers were flagged who would have stayed. For a retention team, that is a good trade. A discount or a check-in call for those 270 costs far less than losing most of the 297.
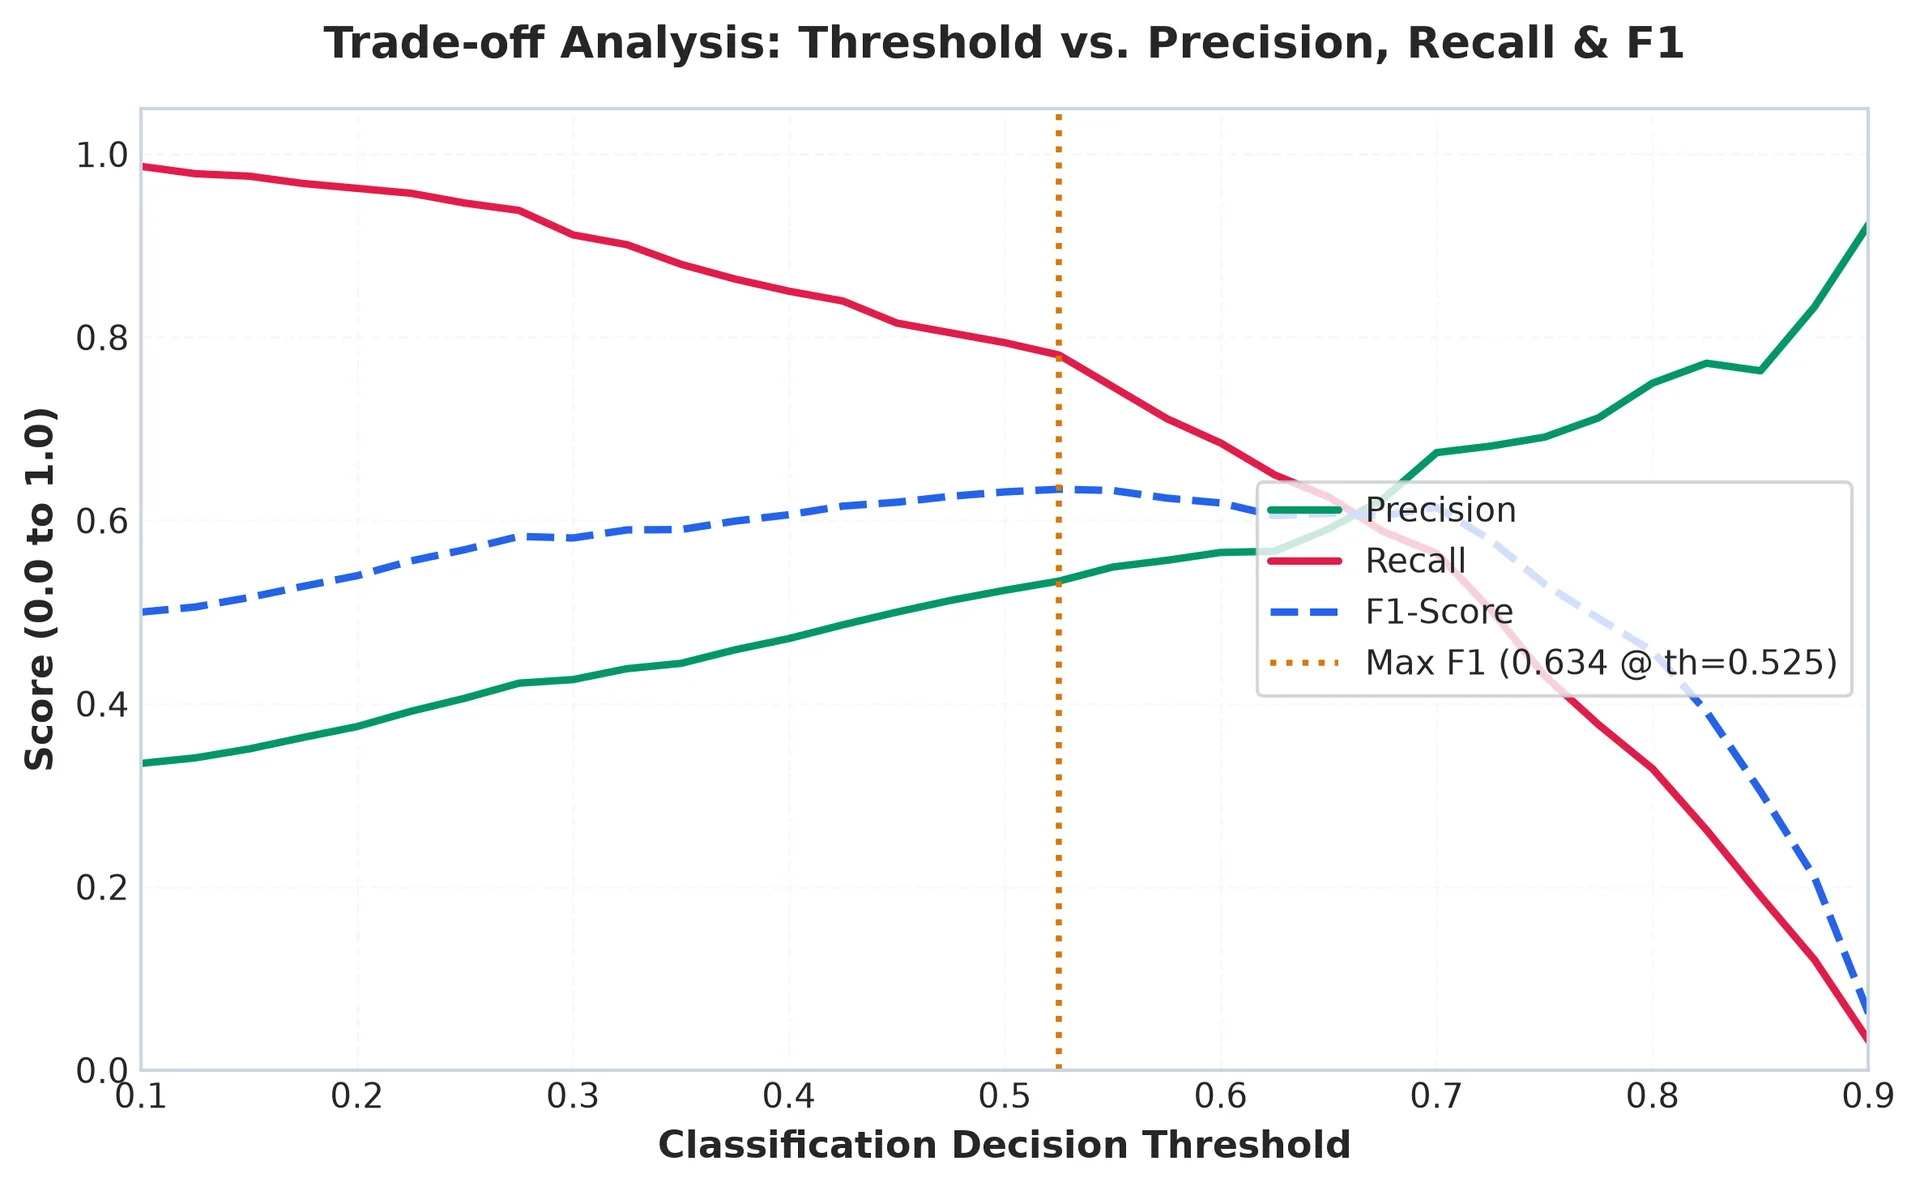
The threshold is a business decision
A classifier outputs a probability; 0.5 is just a default. I built the Streamlit dashboard with an adjustable threshold so a retention team can decide how many false alarms they can afford in exchange for catching more churners. That single slider is more useful to the business than another point of ROC-AUC.
Explaining why someone is at risk
A risk score alone doesn’t tell anyone what to do. TreeSHAP and feature importance showed the main drivers: short tenure (the strongest protective factor once it grows), month-to-month contracts, fiber-optic internet (41.9% churn in this data, linked to higher monthly bills) and electronic-check payments. Each of those maps to an action, such as offering a contract, reviewing pricing or nudging customers to autopay.
What I’d tell myself at the start
- Decide what a mistake costs before choosing a metric.
- Always train a dummy baseline. It tells you what “doing nothing” scores.
- Put every preprocessing step inside the pipeline, or your cross-validation will lie to you.
- Ship the threshold and the explanations, not just the model.
This post is based on one of my projects. You can read the full case study or the code: