Machine Learning · Fundamentals
Regression from scratch: what building Ridge, Lasso and gradient descent taught me
Calling LinearRegression().fit() takes one line. Understanding what happens inside took me a whole project. For HousePriceX, I predicted prices for a dataset of 10,000 real estate properties with every algorithm written from scratch, without scikit-learn.
What I built by hand
- Models: simple, multiple and polynomial linear regression.
- Two ways to fit them: the closed-form Normal Equation and iterative gradient descent.
- Regularization: Ridge (L2) and Lasso (L1).
- Model selection: K-fold cross-validation, forward and backward feature selection, and variance inflation factor (VIF) analysis.
- Evaluation: R², adjusted R², and learning and validation curves.
Real-world data made it harder, which was the point: missing values, outliers, features that move together (multicollinearity) and relationships that aren’t straight lines.
Normal Equation vs gradient descent
The Normal Equation solves for the best weights in one step: w = (XᵀX)⁻¹Xᵀy. It’s exact, but inverting XᵀX becomes expensive as features grow, and it breaks down when features are highly correlated.
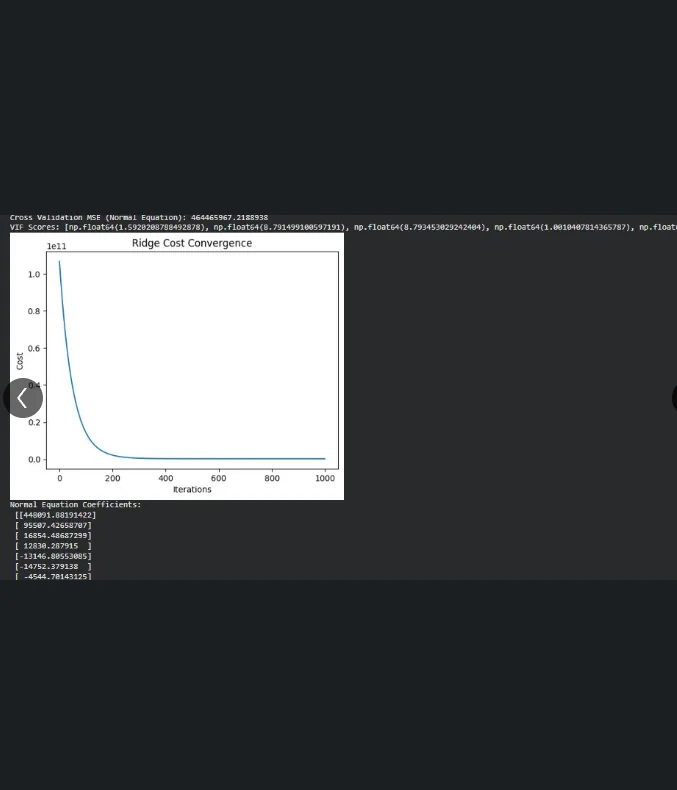
Gradient descent takes small steps downhill on the error instead. Writing it myself made two things concrete. First, feature scaling matters: with unscaled features the cost surface is a long, narrow valley and the steps zig-zag. Second, the learning rate is a real trade-off: too small and it crawls, too large and the cost diverges.
Why regularization exists
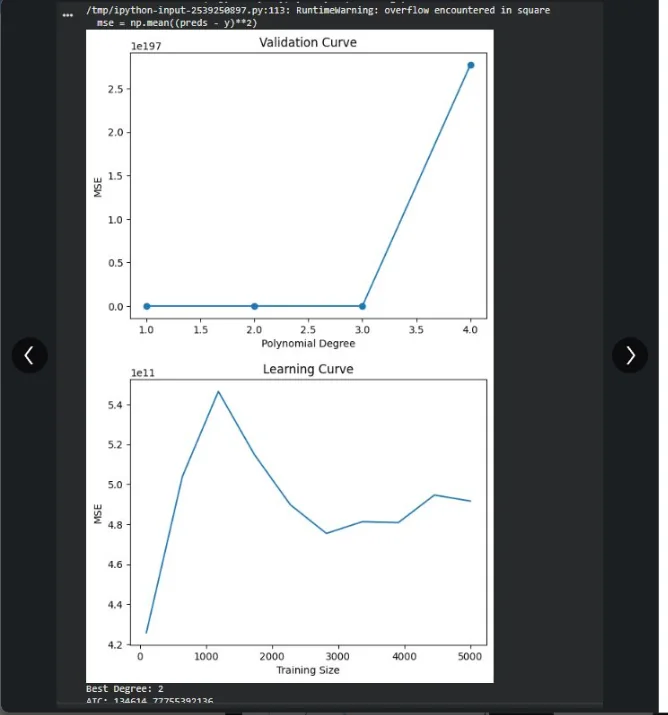
Polynomial features let a straight-line model fit curves, but higher degrees quickly start memorizing noise. Ridge adds a penalty on the size of the weights (L2), which shrinks them and stabilizes the model when features are correlated. Lasso uses an L1 penalty, which can push some weights all the way to zero, a built-in form of feature selection. Implementing both made the difference obvious: Ridge shrinks, Lasso selects.
Multicollinearity and VIF
When two features carry the same information, such as area and number of rooms, the model can’t tell which one deserves the credit, and the weights become unstable. The variance inflation factor measures how well each feature can be predicted from the others. Computing it by hand made it clear why a high VIF is a reason to drop or combine features, not just a number in a report.
Why I’d recommend this to every ML student
Libraries are the right tool for real work, and I use scikit-learn in my other projects. But building these algorithms once taught me why scaling matters, why cross-validation is non-negotiable, and what a regularization parameter actually does. That made me much faster at debugging models I didn’t write.
This post is based on one of my projects. You can read the full case study or the code: